

2018 In Review
To Provide Additional Flight Frequencies and Destinations
YOW’s effort to attract additional capacity and destinations is determined and ongoing. We meet with airlines to discuss the benefits of serving the National Capital Region. We also maintain dialogue with business organizations to understand travel needs and work together to attract sustainable routes. Aircraft are valuable assets, and airlines make their deployment decisions carefully, based on a market’s volume, its yield, and how that geographic location fits into their network strategy.
5 Million!
In December, the airport reached the very significant 5 million-passenger milestone. To mark the occasion, the Authority launched an online advertising and promotion campaign, called “Sparty on the Shelf” to drive engagement and awareness. In collaboration with the Ottawa Senators, we hid 19 Spartacat dolls in locations throughout the airport, pre- and post-security. Participants were encouraged to find Sparty, take a selfie with him, share it on Facebook or Twitter, tagging @FlyYOW and including the hashtag #YOW5million. Four raffle prizes were awarded, along with the grand prize featuring two round trip economy class flights to anywhere an airline flies non-stop from YOW, and $5,000 spending money.
From the nearly 1,000 entries received between December 12, 2018 and January 2, 2019, we drew the winning name. It looks like our winner, Tanya J. from the Smiths Falls area, is planning a getaway to one of our sunshine destinations in the near future. Congratulations to everyone who entered and won!

Air service development
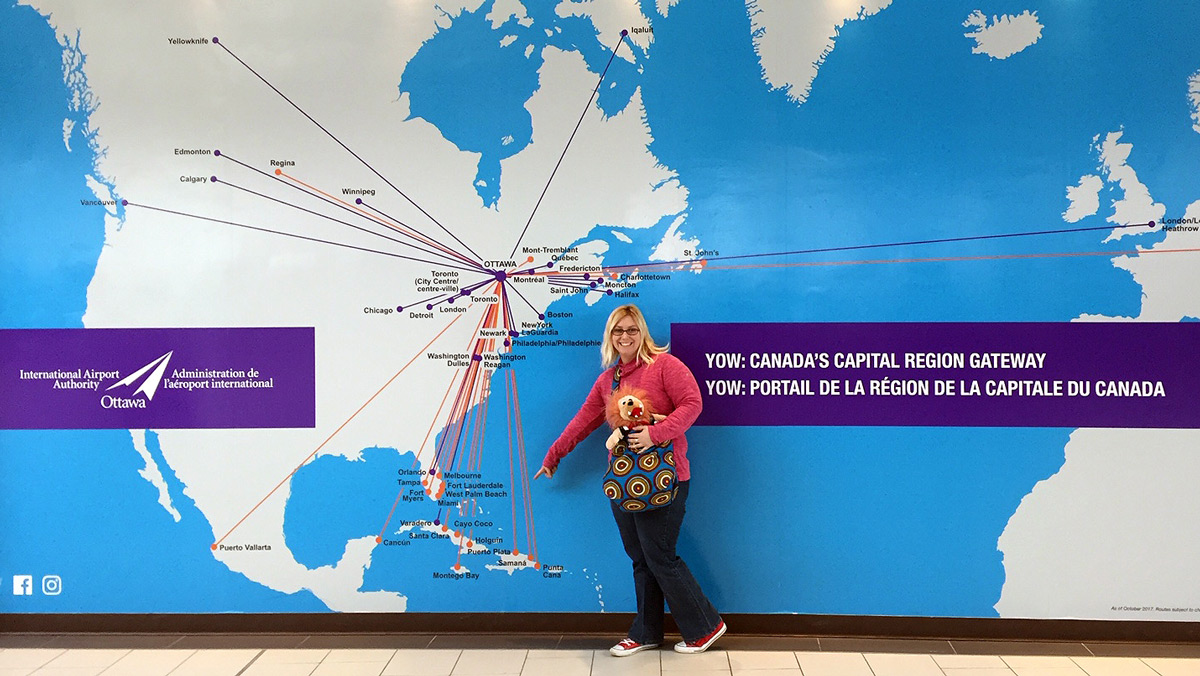
Hitting the 5 million-passenger mark can be attributed to many factors, not the least of which was the resurgence in Transborder traffic. After several years of decline, this segment grew an impressive 11.3%. Delta’s service to LaGuardia has proven to be successful; American added an additional frequency to Philadelphia bringing their daily total to three; United added capacity to Newark and Washington-Dulles, also increasing the daily total for each destination to three.
Domestic traffic, which is still the airport’s strongest segment, grew 4.9%. This increase is due to Air Canada’s increase in capacity to Toronto-Pearson, and Calgary; Porter’s increased frequency to Toronto-Billy Bishop; and WestJet’s additional daily frequency to Vancouver and Halifax.
International traffic also saw gains to the tune of 2.5%. Air Canada’s year-round non-stop service to London, Heathrow continues to perform well, as does their seasonal Frankfurt service. Both Air Canada and WestJet reduced winter service to warm weather destinations; however, Sunwing filled the void announcing new routes to Miami, U.S. and Los Cabos, Mexico, for 2018, as well as serving an additional eight Florida and Caribbean destinations.
| TOTAL | |
|---|---|
| 1997 | 20 |
| 1998 | 21 |
| 1999 | 25 |
| 2000 | 26 |
| 2001 | 29 |
| 2002 | 30 |
| 2003 | 32 |
| 2004 | 25 |
| 2005 | 39 |
| 2006 | 44 |
| 2007 | 49 |
| 2008 | 49 |
| 2009 | 49 |
| 2010 | 50 |
| 2011 | 49 |
| 2012 | 49 |
| 2013 | 49 |
| 2014 | 50 |
| 2015 | 49 |
| 2016 | 46 |
| 2017 | 46 |
| 2018 | 47 |
| TOTAL | |
|---|---|
| 1997 | 68,000 |
| 1998 | 77,202 |
| 1999 | 81,808 |
| 2000 | 78,301 |
| 2001 | 72,630 |
| 2002 | 68,499 |
| 2003 | 69,798 |
| 2004 | 69,626 |
| 2005 | 66,146 |
| 2006 | 65,396 |
| 2007 | 72,342 |
| 2008 | 79,777 |
| 2009 | 81,120 |
| 2010 | 86,009 |
| 2011 | 90,949 |
| 2012 | 90,697 |
| 2013 | 83,567 |
| 2014 | 78,073 |
| 2015 | 75,107 |
| 2016 | 74,345 |
| 2017 | 74,755 |
| 2018 | 77,728 |
| DOMESTIC | TRANSBORDER | INTERNATIONAL (WEEKLY) | |
|---|---|---|---|
| 1997 | 82 | 21 | 3 |
| 1998 | 88 | 23 | 6 |
| 1999 | 101 | 39 | 7 |
| 2000 | 93 | 43 | 7 |
| 2001 | 84 | 30 | 7 |
| 2002 | 80 | 35 | 8 |
| 2003 | 81 | 35 | 7 |
| 2004 | 71 | 35 | 7 |
| 2005 | 60 | 32 | 9 |
| 2006 | 60 | 29 | 9 |
| 2007 | 70 | 31 | 11 |
| 2008 | 77 | 32 | 13 |
| 2009 | 80 | 29 | 14 |
| 2010 | 86 | 30 | 17 |
| 2011 | 93 | 30 | 22 |
| 2012 | 91 | 31 | 25 |
| 2013 | 84 | 27 | 22 |
| 2014 | 80 | 24 | 23 |
| 2015 | 78 | 21 | 24 |
| 2016 | 80 | 20 | 23 |
| 2017 | 82 | 19 | 23 |
| 2018 | 85 | 20 | 20 |
Origin and destination
94.0% of traffic (estimated)